|
Measurement of the resolution of scanners
The resolution of a scanner is a decisive criterion of purchasing. Finally, it depends on it how many details can be taken out of an original, how big the resulting image files are and how big the reprints/print-outs can be made of a scan and/or to which degree it is possible to amplify the cutouts of an image.
The modern flat bed scanners and filmscanners abound with impressive values of resolution. Without spending much money, one can already get some devices with a scan-resolution of thousands of dpi. But how should one think about such promising mere numbers? Are these only some theoretical producer data or are these values also achieved in the practice? Some producers talk about an optical resolution, others from interpolar resolution. What are the differences?
This chapter is fully dedicated to the subject resolution of scanners. Beside of theoretical basics, a procedure of measurement is introduced to learn how the resolution of a flat bed scanner or a slide scanner can be measured.
What do the data of the resolution in DPI mean?
There are countless variants to indicate the resolution of a scanner or a printer. DPI (dots per inch), PPI (points per inch), LPI (lines per inch), line pairs per millimeter etc. is repeatedly heard if it is about the data of the resolution. What does such a data mean and what can be do with it?
In the field of filmscanners, flat bed scanners and printers, the most common way to indicate the resolution DPI. The abbreviation DPI is for Dots Per Inch. Accordingly, a printer with a resolution of 600 dpi prints 600 points within the stretch of one inch.
1 Inch = 2,54 cm
What can be exactly pictured under 600 dpi? Inch is an american measurement for length; 1 inch is equivalent to 2,54 cm. If we divide the resolution of 600 dpi by 2,54 cm we get a resolution of 236 points per cm. Thus, our printer prints 236 points within a length of 1 cm and/or 23 points per millimeter.
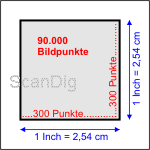
Which significance has the resolution of a scanner or a printer in the practice, beside the fact that the higher the resolution, the better is the a scan/print-out? As a guideline, there is to apply: in order to make a high quality hard copy of an image, the resolution should be at least of 300 dpi. Thus, 300 dpi means 300 dots per inch, thus 118 dots per cm. Thus, a quadrate with an edge length of 1 Inch contains 300 x 300 = 90.000 image dots. This is equivalent to 13.950 image dots in one cm². While the resolution of an image for a high quality print-out requires at least 300 dpi, for the proper representation of an image on the screen, exactly 72 dpi are sufficient.
If a printer does not have a resolution of 300 dpi but 600 dpi or higher, this effects a slight increase of the quality. But resolutions that are of a much higher value are quite meanless, as the print result gets hardly better by a higher resolution but the printing process considerably slows down. The matter is completely different in the case of filmscanners. If a slide of the size 24 x 36 mm was scanned with exactly 300 dpi, it would be possible to produce a high quality hard copy in exactly this format. Of course, no one wants to print its slides as stamps but make considerable amplifications. If a hard copy with the format DIN A4 (21x29,7cm) is to be made with the optimal resolution of 300 dpi, a resolution of approximately 2.500 dpi is neccessary.
The principle that an image of a high resolution should have a resolution of 300 dpi is based on the resolution capacity of the human eye: at a normal distance of observation of 25 centimetres, the eye can diferentiate a maximum of 6 line pairs per millimetre. But 6 line pairs per millimetre mean 12 alternating black and white lines per millimetre; an inch consists on approximately 25 mm, so that in one inch, 12 x 25 = 300 lines can be differentiated. Thus, the human eye cannot recognize anymore a higher resolution at a normal distance of observation.
Which resolution does a slide of 35 mm or a negative have?
The academics, experts, scanner operators and many people that are involved in photography and image editing dispute about the question of how many image dots can be taken out of an image of little format (35 mm film). It is logical that the number of the image dots in a slide of little format depends on the type of the film. A film with 200 ASA is, of course, more coarse grained as one with 50 ASA. Also within the respective film rapidness there are differences between each of the films.
Therorically, a very good film might differentiates 40-60 millions of dots on a surface of an image of little format. In order to be able to iluminate each of these dots differently, the film has to be located in a magnificient camera and have an excellent objective in front of it. The simple standard-objectives are hardly able to place more than 10 million of image dots (equivalent to 2800 dpi) on a slide of a little format. The objectives for professionals or the prime lens objectives can break the 20 million limit (equivalent to 4000 dpi).
Thus, for a normal camera equipment a scan with 2800 dpi is sufficient to take approximately 10 millions image dots out of an image of little format. With a scan of 4000 dpi, those who have a high quality equipment and use some excellent films can take approximately 20 millions image dots out of a slide of little format. But then, what are the scanners with 4000 dpi and more resolution for? Does it make sense at all to think in such big dimensions?
The answer is clearly yes. During the scan of a film, there are interferences as aliasing, other interferences, etc. They are all related to the intermediate effects of the used resolution of the scanner and the actual image resolution. The higher the scan resolution, the lower are those interferences. Thus, it does make sense to scan an original with 4000 dpi that has a resolution of only 2500 dpi by itself.
Theorical resolution against the practical resolution
Those who look at the data sheets of the film scanners and the flat bed scanners will be dazzled by the huge values of resolution. The producers of the flat bed scanners that in former times worked with values between 300 and 600 dpi, declare today resolutions of more than 3000 dpi. Today, the filmscanners work with resolutions of 4000 dpi and more - in former times, those margins could only be handled by the huge drum scanners. Even in the data sheets of the most simple slide scanners there are already resolutions of partly up to 7200 dpi mentioned.
Those mere numbers can easily impress. Some buyers of a scanner do only decide to buy their device in accordance to such apparently measurable sizes, without thinking of what is really behind it. Here, I absolutely want to underline a very important fact:
The information of the producer about the resolution is a theoretical value that is only achieved in the practice by scanners of a very high quality.
Unfortunately, it often occurs that a producer introduces a scanner into the market with a resolution of 7200 dpi, but in the practice, not even the half of this resolution is achieved. This sounds like cheating the client, doesn´t it? What is the information of the producer for at all? If for example, the information about a scanner is that 3000 dpi are achieved in the transport direction, this means that the transport motor moves the ccd sensor ahead in 3000 single steps per inch. But with that, it is not said if the sensor is so precise that it can really distinguish 3000 different image lines within a stretch of 1 inch. This is comparable with an ink-jet printer: a printer with a resolution of 600 dpi does not neccessarily have to deliver better print-outs than a device with only 300 dpi; the higher resolution is only then important, if each of the single needles also do work so precisely that 600 image dots per inch are individually printed or omitted.
In order to shed light on the dark of the producer information concerning the resolution of the scanners, the following subchapters are dedicated to a method for the measurement of the resolution of the scanners. With the test chart that will be described in the following, it will be possible for everybody to measure the resolution of the own scanner by oneself
Determination of the resolution of the scanner with the help of a test image
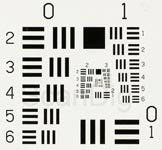
In order to measure the actual resolution of a scanner, a standarized model as the USAF-1951 test target is used. In a scanner, a resolution test works similarly to the eyesight test of a person: there are some samples on the test target that get smaller from element to element. The smaller the element that the scanner can still "read", the higher the resolution of the scanner.
In the USAF 1951 Chart that is described in the following chapters, each of the elements consist on horizontal and vertical line pairs of a certain size and that are ordered in a very special way. If the scanner can still distinguish the black lines from the white background, the respective element is considered to be resolved and a determined scanner resolution in DPI corresponds to this element.
In the following, the structure and the practical application of an USAF-1951 test-target is described in detail.
The USAF-1951 test target
The USAF-1951 test image contains numerous standard elements that get continuously smaller in order to measure the actual resolution of a scanner. Each of the elements, as also the structure of the test target are standarized according to MIL-STD-150A that is an American military standard.
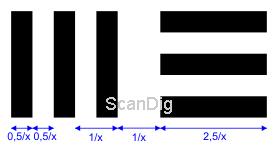
An element on the test target consists on 3 horizontal and 3 vertical lines of a certain length and width as also a certain distance. Each of the lines are 5 times longer than wide; the distance between two lines is exactly equivalent to the width of a line. In the adjoining draft of the element all measures are given as a value/x. Thereby is x the resolution in line pairs per millimetre. A line pair is always a black line plus a white line. For example: if x = 1, then the resolution is 1 line pair per millimetre. Then an element has a length of L = 2,5/x = 2,5mm and the width is L = 0,5/x = 0,5mm.
The USAF 1951 test image consists on several groups that are serially numbered with -2, -1, 0, 1, 2, 3, 4.... Each group consists on 6 elements as described above with
| |
Resolution x |
Width |
Length |
| Group 0 Element 1 |
1,00 |
0,50 |
2,50 |
| Group 0 Element 2 |
1,12 |
0,45 |
2,23 |
| Group 0 Element 3 |
1,26 |
0,40 |
1,98 |
| Group 0 Element 4 |
1,41 |
0,35 |
1,77 |
| Group 0 Element 5 |
1,59 |
0,31 |
1,57 |
| Group 0 Element 6 |
1,78 |
0,28 |
1,40 |
| Group 1 Element 1 |
2,00 |
0,25 |
1,25 |
Table no. 1: Size of each of the elements
3 horizontal and 3 vertical lines each. Within a group, each of the elements get smaller by the factor 2-1/6 and/or the resolution x increases from element to element by the factor 21/6. For example, group 0:
For the first element of the group 0, we see in the table a resolution of x = 1 lp/mm. It is recognizable how the resolution increases by the factor 21/6 from element to element. Accordingly, the first element of the group 1 has the double resolution, thus x = 2 lp/mm; the width and length of one single line are respectively half as big as the respective element of the group 0. As a rule of thumb, we memorize:
The first element of the group 0 has a resolution of 1 line pair per millimetre. The resolution duplicates from group to group; the size of each of the elements are cut by half. Within a group, the resolution increases from element to element by the factor 1,12.
Another word regarding the single groups on an USAF-1951 test chart: the applied targets have as the biggest group on the target the index 0, that means that on a slide model, a black line of the biggest element measures 2,5 x 0,5 mm. The smallest group has the index 7; thereby, the scan resolutions are measurable up to 11586 dpi. There are also other test targets with other and/or several groups. On a test target with the group -2, a black bar of the first element has dimensions of 10 x 2 mm.
Application of the USAF-1951 test target
In practice, one does not have to care about the theorical background and the mathematical relation between each of the elements. From the mathematical relation that is explained in the previous chapter, a table can be issued for each of the elements of the groups in order to represent the scanner resolution. In the following table, the resolution x is stated in line pairs per millimetre. From element to element(in a column downwards), the resolution increases by the factor 1,12. From group to group (in a line to the right), the resolution doubles.
| Element |
-2 |
-1 |
0 |
1 |
2 |
3 |
4 |
5 |
6 |
7 |
| 1 |
0,25 |
0,50 |
1,00 |
2,00 |
4,00 |
8,00 |
16,00 |
32,00 |
64,00 |
128,00 |
| 2 |
0,28 |
0,56 |
1,12 |
2,24 |
4,49 |
8,98 |
17,96 |
35,92 |
71,84 |
143,68 |
| 3 |
0,31 |
0,63 |
1,26 |
2,52 |
5,04 |
10,08 |
20,16 |
40,32 |
80,63 |
161,27 |
| 4 |
0,35 |
0,71 |
1,41 |
2,83 |
5,66 |
11,31 |
22,63 |
45,25 |
90,51 |
181,02 |
| 5 |
0,40 |
0,79 |
1,59 |
3,17 |
6,35 |
12,70 |
25,40 |
50,80 |
101,59 |
203,19 |
| 6 |
0,45 |
0,89 |
1,78 |
3,56 |
7,13 |
14,25 |
28,51 |
57,02 |
114,04 |
228,07 |
Table no. 2: Resolution in line pairs / millimetre
How is it possible to get from the resolution given in line pairs per millimetre to DPI (Dots Per Inch)? As described above, 1 inch can be calculated into 25,4. Thus, the values of the table above have to be multiplied with 25,4. A further multiplication with the factor 2 is neccessary, as per the definition, a line pair always consists on two lines. Thus, with the factor of conversion of 50,8, the following table is obtained:
| Element |
-2 |
-1 |
0 |
1 |
2 |
3 |
4 |
5 |
6 |
7 |
| 1 |
13 |
25 |
51 |
102 |
203 |
406 |
813 |
1626 |
3251 |
6502 |
| 2 |
14 |
29 |
57 |
114 |
228 |
456 |
912 |
1825 |
3649 |
7299 |
| 3 |
16 |
32 |
64 |
128 |
256 |
512 |
1024 |
2048 |
4096 |
8193 |
| 4 |
18 |
36 |
72 |
144 |
287 |
575 |
1149 |
2299 |
4598 |
9196 |
| 5 |
20 |
40 |
81 |
161 |
323 |
645 |
1290 |
2580 |
5161 |
10322 |
| 6 |
23 |
45 |
91 |
181 |
362 |
724 |
1448 |
2896 |
5793 |
11586 |
Table no. 3: Resolution in DPI
Thus, in order to determine the resolution of a filmscanner or a flat bed scanner, a USAF-1951 test image is to be scanned with the highest resolution of the scanner and then one observes each of the line elements. If the scanner is able to resolve the three black lines in front of the white background, the respective resolution in DPI of the respective element is given in the table. Some scanners have a different resolution in the horizontal and vertical direction. By means of the horizontal and vertical line groups within an element, the horizontal and the vertical scanner resolution can be determined separately.
The USAF1951 test target with each of its elements and the calculation of the resolution is standarized. But there is no regulation for the analysis of the test scan. Many times it is difficult to judge if an element is still resolved or not. Most of the times, one stucks between two elements; the difference of the resolution between two elements is of 12%. Accordingly, in the half of this area, thus 6%, the impreciseness and/or the matter of interpretation of the procedure happens.
Brief instruction for the determination of the resolution with the test target
In order to clarify the annotations and the mathematical explanations above, a brief instruction follows of how to determine by oneself the actural resolution of the own scanner with the help of an USAF-1951 test target:
- Scan an USAF-1951 test target with the highest resolution of the scanner. All correcting procedures and filters are to be switched off. Save the scan in an uncompressed TIF format.
- Open the scan in the image editing program and choose the zoom factor of 100% original size.
- Analysis of each of the elements: the three black bars have to rise above the white background. Attention: the scanner can have a different resolution in the horizontal direction than in the vertical direction.
- Read off the DPI value from the table no. 3 for the element that in the image editing programm it is still represented with a high resolution.
An USAF-1951 test chart is available in our Filmscanner-Shop as a non-framed transparent. The transparent can either be put on a glass surface (flat bed scanner, glass surface in case of film scanners) or framed into a frame for images of little format.
USAF-1951 target scans with different scanners
Our scanner test report pages contain numerous USAF-1951 test scans. There are film scanner of a high quality that exactly meet the specified resolution, and there are other devices that in the practice do not achieve even 50% of the resolution stated in the data sheet. Many times, the cheap flat bed scanners with a transparency unit achieve in the practice only 30% of the nominal resolution.
In order to compare the different devices to each other, in our test report pages we always state the effective resolution of the scanners, thus the measured resolution that the scanner actually achieves in practice.
Back to the index Know How
|
|